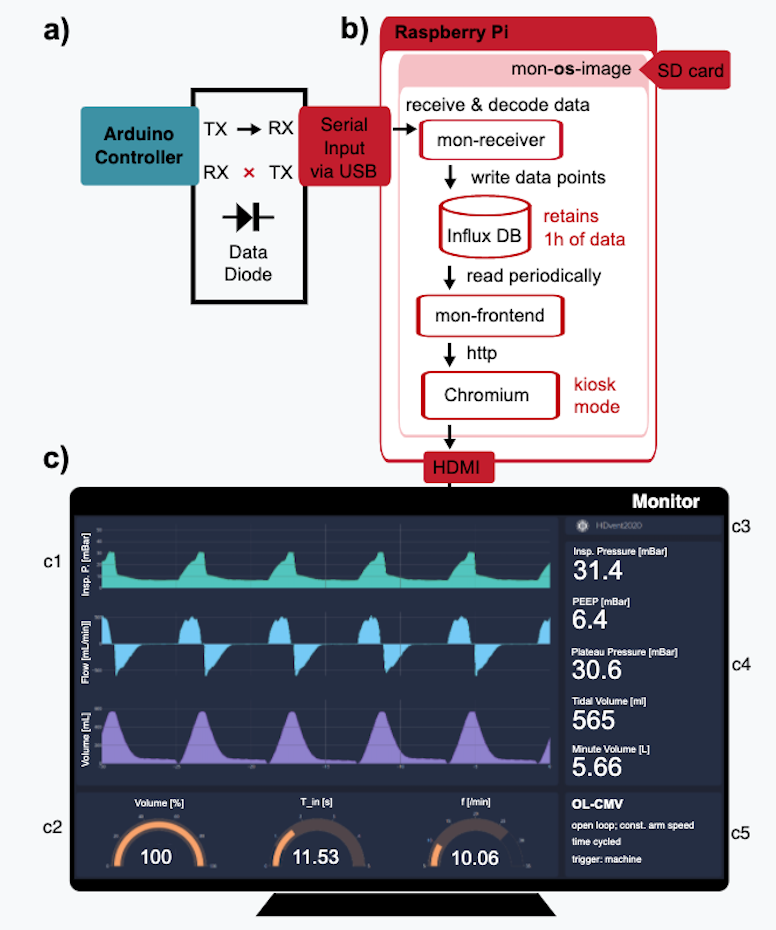
The monitoring unit is an optional component to display information on the machine state and patient condition to HDVent operators. It features plug & play operation, unidirectional data transfer, data buffering and kiosk mode. It builds upon low-cost off-the-shelf hardware, open source software components and is compatible to widespread display technology.

A Raspberry Pi (Pi) (Model 4B, Rev.1, 4G) serves as the main controller. It is connected to the ventilator controller via a USB to UART (Universal Asynchronous Receiver Transmitter) bridge in a simplex transmission setup, establishing a unidirectional serial link that prevents any detrimental influence on ventilation control by system failure and incorrect or malicious operation of the monitoring unit (Fig. a). The Pi HDMI port allows connection to standard computer monitors. The wireless and ethernet network interfaces carry potential for data aggregation from multiple ventilation units on a single monitor in future setups.
The software system is built on a customized Raspberry Pi Operating System (OS) image. Unnecessary components were removed from the OS image to reduce its size and attack surface in networked setups.
- On boot the OS automatically starts up all services and applications required to ingest incoming ventilator data and generate the dashboard view.
- The service mon-receiver checks incoming serial transmissions for errors and decodes the COBS (Consistent Overhead Byte Stuffing) encoded serial stream into named data points.
- The decoded and timestamped data points are written to a time-series database InfluxDB that stores one hour of historical data. This allows for protocol extensions with additional data points sent from of the ventilator controller without the need to modify mon-receiver.
- The application mon-frontend periodically reads and aggregates data from the database, derives values such as minimum or maximum values and serves a web interface built with Dash. The interface is rendered on the Pi in the web browser Chromium, running in kiosk mode to output to the HDMI port in full screen.
The interface combines graphical representations of user configurable ventilator controller settings, time traces of inspiratory pressure, flow and volume and numerical indicators for the remaining diagnostics. Visual alarms display when preset thresholds are exceeded. The interface updates automatically once per second. It is read-only by design and cannot alter database entries or the ventilation controller settings.